Setting up reports in Google Analytics 4
The predefined reports in GA4 offer comprehensive insights into user behaviour and the overall trends in your marketing efforts. If you are used to the old UA setup, it can be a challenge to find the same views and data in GA4.
Google Analytics 4 gives you the ability to customise reports exactly to your needs. You can build the data views you require by adding the specific metrics you want to analyse — a flexibility that was not possible in the old Google Analytics (UA). In this guide, we introduce you to how you can tailor your Google Analytics 4 reports. But first, let us take a closer look at what a general report can look like.
Setting up traffic acquisition
To give you a clear overview of how to set up general reports, we will start with a walkthrough of a traffic acquisition report.
This report allows you to see where your traffic comes from, as well as the number of purchases and enquiries made in a given period. This insight is essential for understanding traffic sources and optimising your marketing strategies.
In your Google Analytics 4 account, click Reports → Acquisition → Traffic acquisition
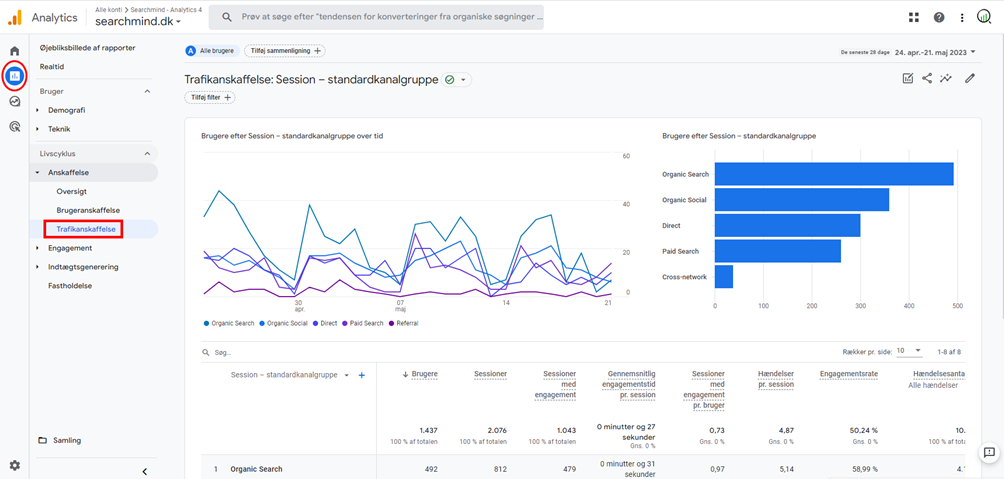
In the main GA4 view, you are now presented with two charts at the top and a detailed table at the bottom. This layout provides a general visualisation of your data.
If desired, you can choose to hide some of the charts and only display the bottom table, which shows in detail where your traffic comes from. More on this in the next section. Before we move on, it may be beneficial to adjust the channel group to achieve an overview similar to the old Analytics.
Click Session – default channel group → Select Session source / medium
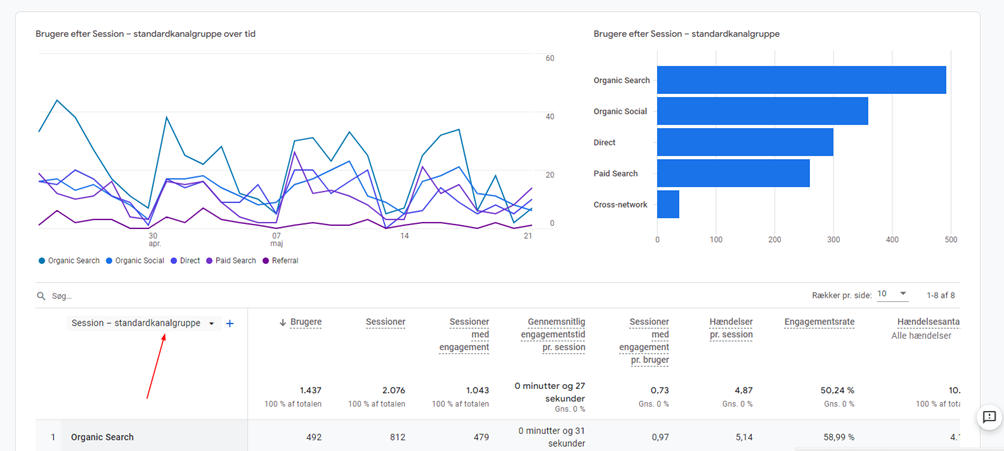
This gives you a more concrete overview of which channels are generating traffic to your website.
This insight is valuable when working with relevant CTAs on the most visited pages. In addition, you can include links to relevant content to keep visitors on the website.
Customise the layout of your GA4 reports
To get started customising your Google Analytics 4 reports, you first need to decide what you want to see in the view. Let us start by getting an overview and removing some of the charts from the view.
In the top right corner, click the icon: Customise report
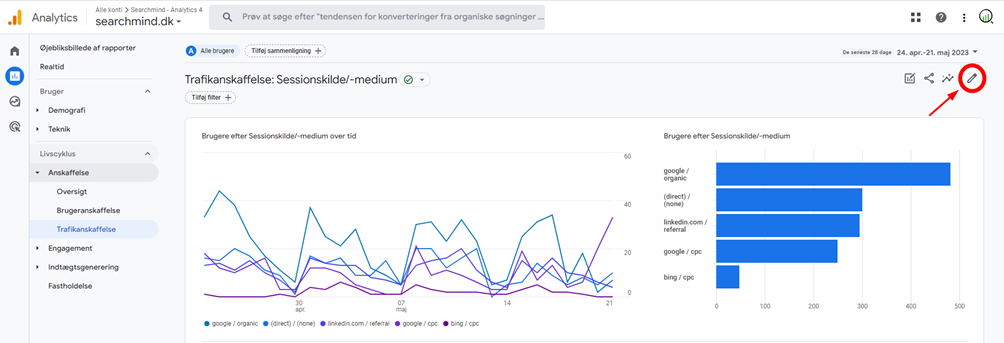
A panel will appear on the right-hand side, showing the different views in the report that you can change.
To hide a chart, you can click the eye icon next to the two default charts:
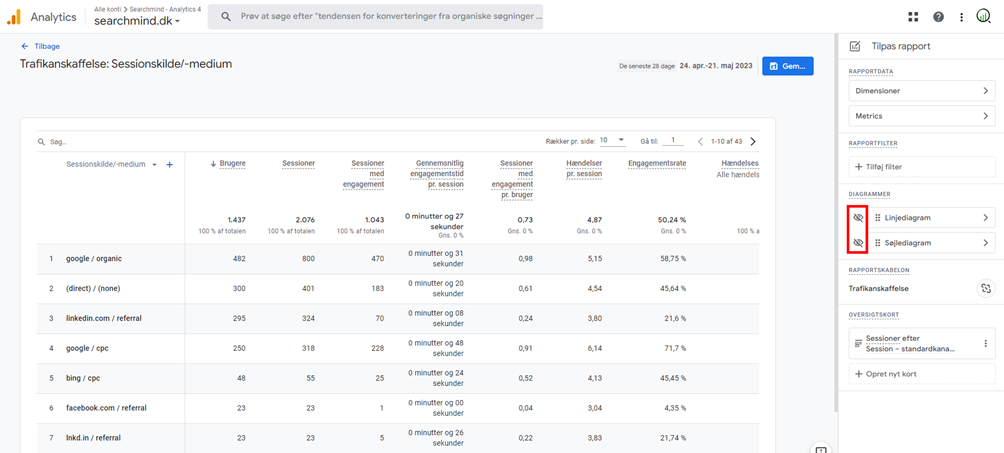
You should now be left with only the detailed table remaining in the view.
Next, you can look at which metrics you want displayed in the table. Click Metrics
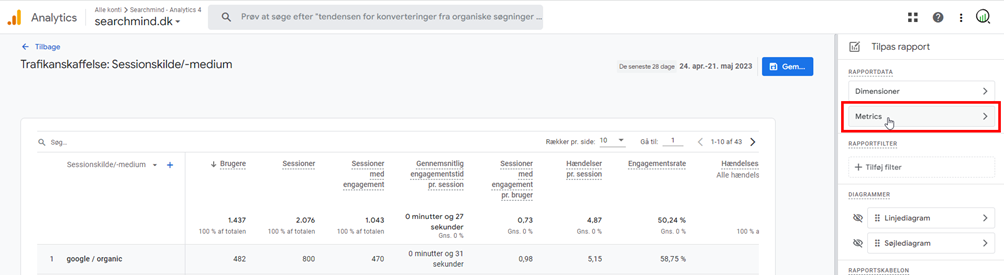
You will see a list of the metrics displayed in the table. If you want to remove one or more metrics from the report, you can click the X button next to the relevant metric.
Note: Removing metrics in this way does not stop GA4 from collecting the data. It will still be available, but simply excluded from the current view.
In the list of metrics, you can choose what to include in the report and sort how the information is presented. This is done by dragging the individual metrics up or down in the list.
Once you have selected the metrics you want to measure and include in your report, and have arranged them in the desired order, click 'Apply' to update the report.
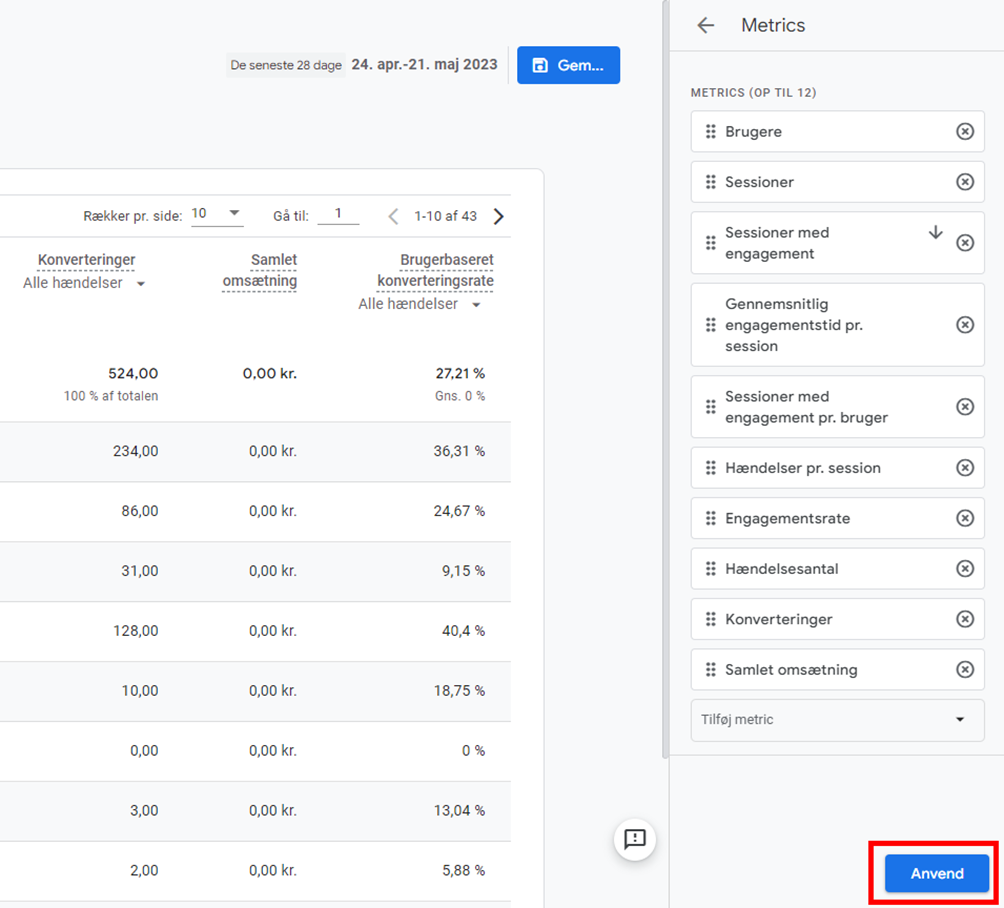
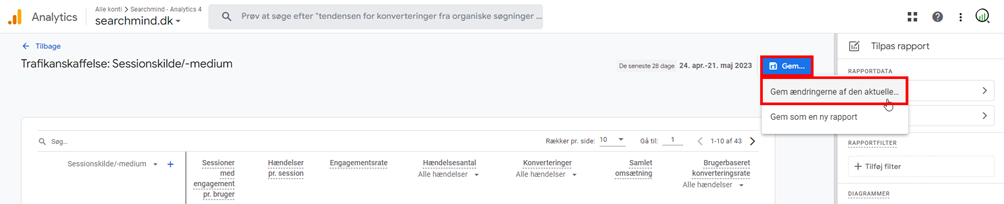
To save all the changes you have made, subsequently click Save → Save changes to current report
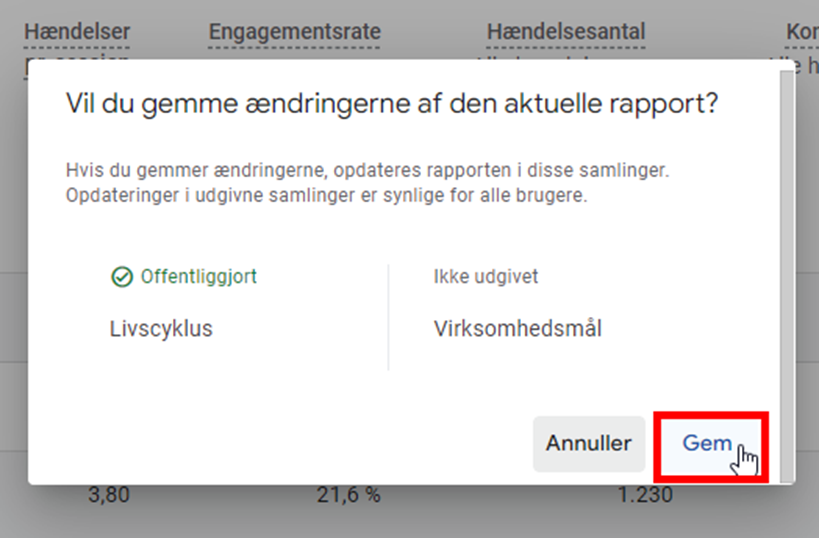
A pop-up will appear. Click Save one final time.
You should now have a good understanding of how to customise your GA4 report by selecting the metrics you consider most relevant. This gives you a better overview of the various metrics and data on your website in Google Analytics 4.
The customised reports can, among other things, provide you with insights into:
- The conversion rate on selected landing pages
- Customer Lifetime Value (CLV)
- Keywords with the highest visibility
And to give an example of setting up a customised report in GA4, you have the opportunity to learn more about your customers through the setup of the customer funnel.
Gain insights into the customer journey through GA4
Funnel exploration in Google Analytics 4 allows you to visualise the steps your users go through to complete a given action. This enables you to analyse whether the various steps in the webshop are performing by gaining insights into:
- webshop
- How many complete an order on the site, etc.
By analysing funnel exploration in GA4, you will notice a drop-off of users after each step in the funnel. This happens because not all users who visit the site and enter the first step of the customer funnel will naturally complete each subsequent step. The drop-off or bounce rate increases the deeper the funnel setup goes.
With a correct setup of GA4, including events and funnel exploration, you have the opportunity to collect valuable information that can be used to improve the customer journey. Understanding where and why customers drop off on the site provides valuable data for optimising the landing pages that are performing less well.
This data can also be effectively used to customise and target your campaigns via Google Ads, Paid Social and similar platforms.
Setting up funnel exploration in GA4
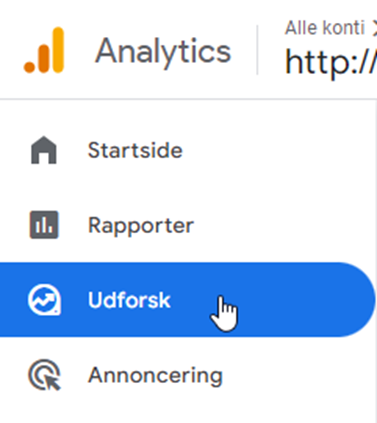
Go to your Google Analytics 4 property and click 'Explore' in the left-hand side.
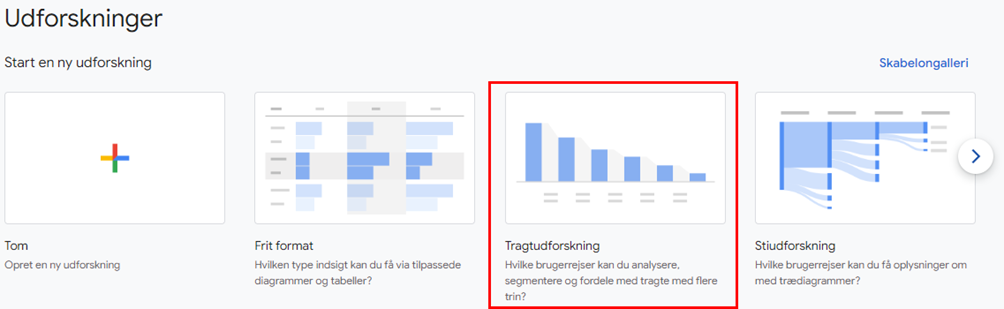
Here you will see various templates with the predefined explorations in GA4. Click 'Funnel exploration'.
A new console will open as shown below:
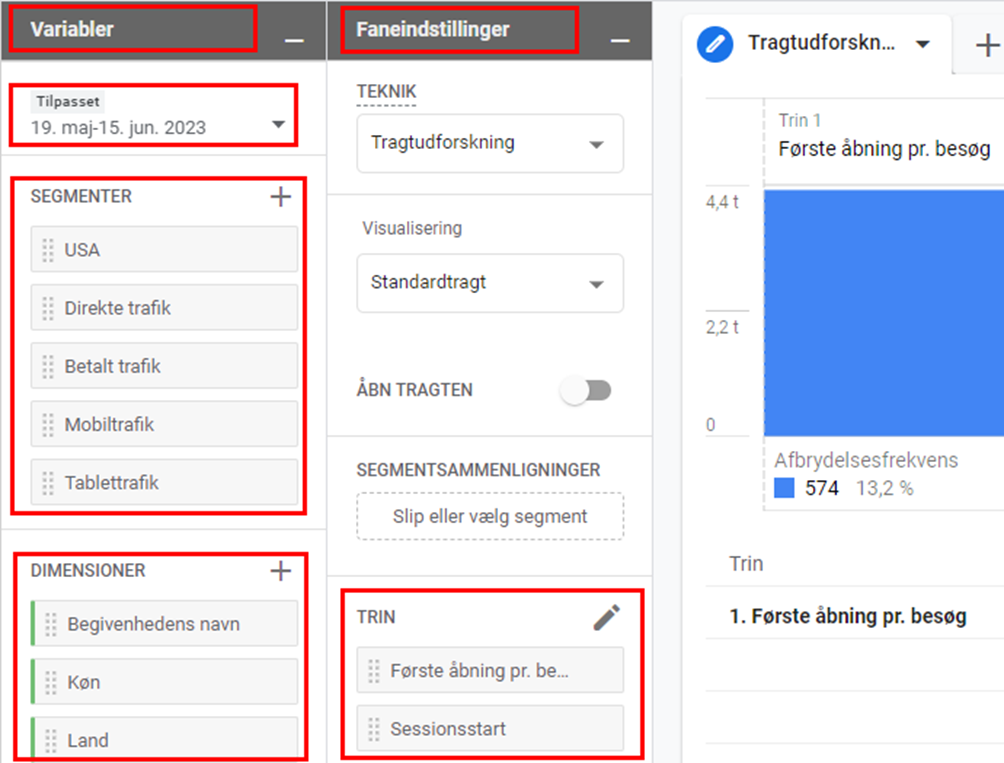
The view is divided into three columns: 'Variables', 'Tab settings' and 'Funnel exploration'.
- Variables
In this segment, dimensions and metrics are called variables. Here it is possible to change the date range and the name of the exploration under the variables column.
- Tab settings
Allows you to choose other visualisations of the funnel. You also have the option to add segments and define the steps you want to measure in the funnel.
- Funnel exploration
Based on the segments you have set up above, the relevant data is displayed here regardless of adjustments and customisation.
A default view with predefined steps looks like this:
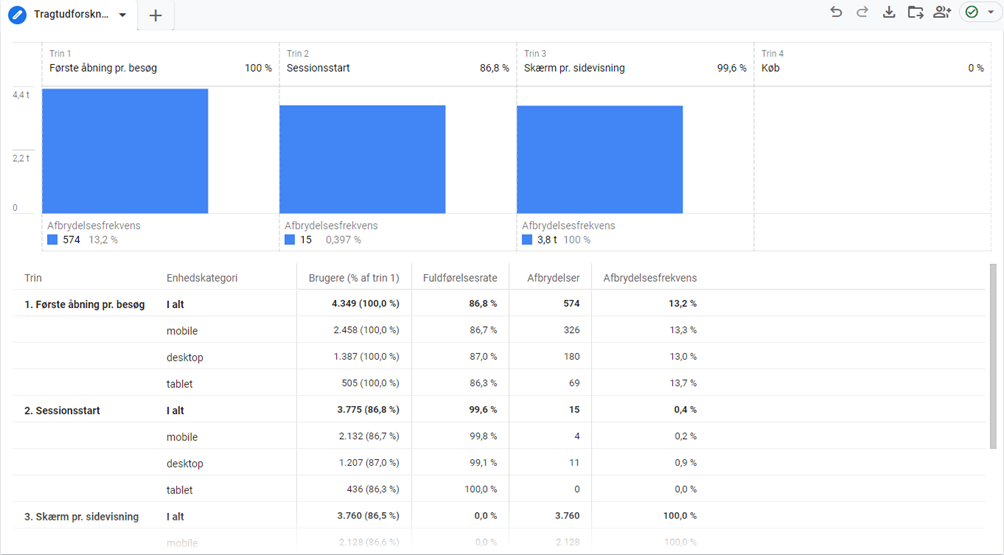
Example of a funnel exploration
The following section is an example of how the above metrics can be used to display how users on a given page behave.
In this case, we want to find out how many customers have requested a quote for a trip over the last 14 days, based on having visited all landing pages containing /destinations.
First, the date range must be adjusted to the desired period for which the relevant data should be displayed. Next, the steps must be edited under tab settings.
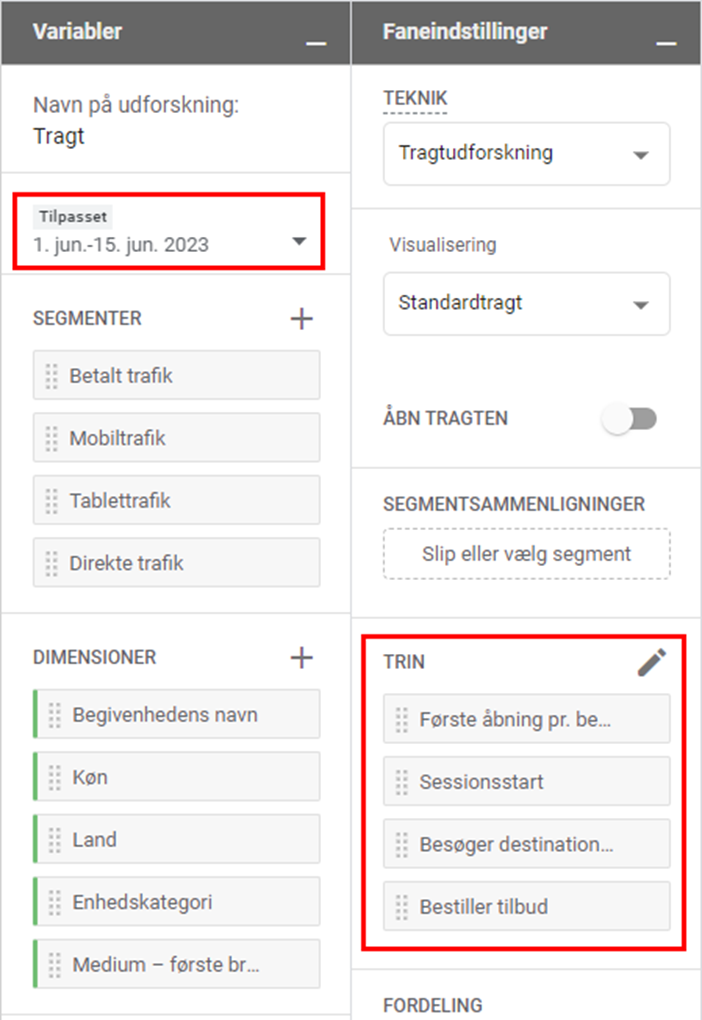
Next, the first opening of the website via all traffic sources is targeted in step 1. Subsequently, step 2 is defined, which in this case involves starting a session in the form of an interaction with the site.
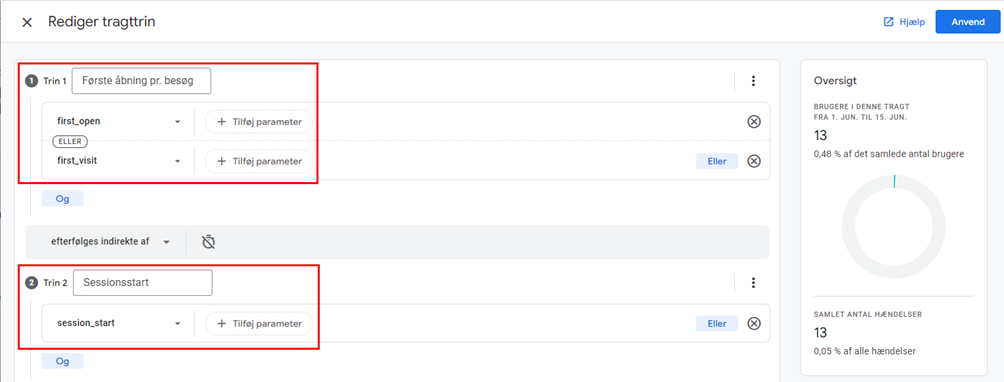
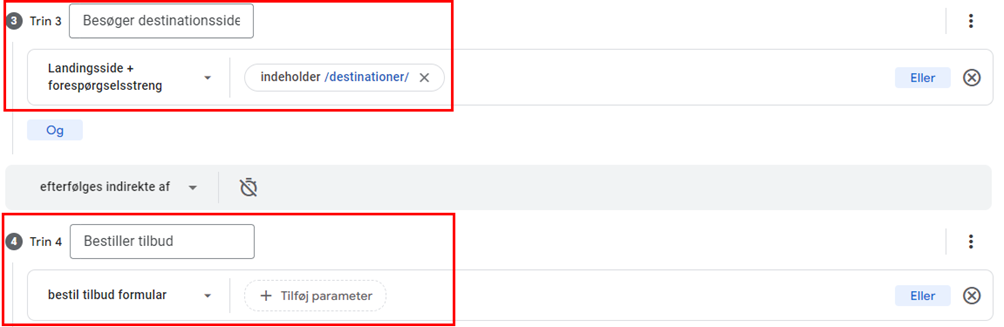
In the next steps, the landing pages you want to measure visitors on are defined, after they have first arrived on the site via steps 1 and 2.
Here, 'Landing page + query string' containing /destinations/ is targeted in step 3.
In step 4, it is possible, using events already set up on your GA4 property, to target users who have clicked the “Request a quote” form on the site. This applies exclusively to the landing pages targeted in step 3.
Finally, click 'Apply', which then generates the desired funnel exploration:
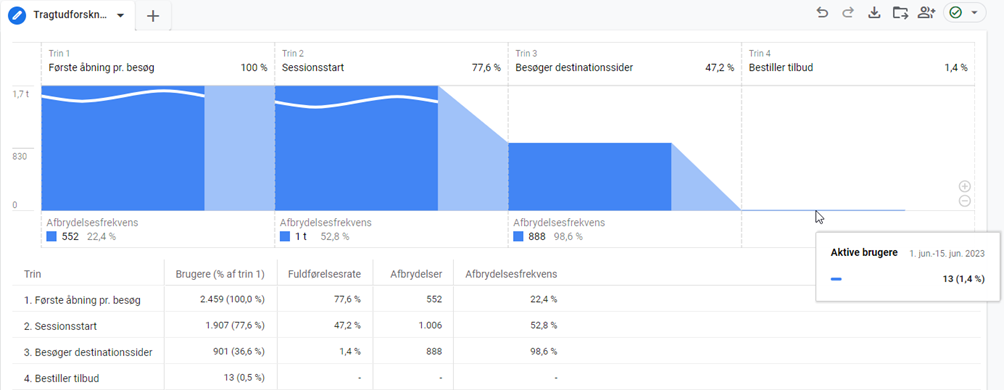
You have now gained insight into how many visitors on the site, after their first visit, end up on pages with /destinations and subsequently request a quote.
There are countless different configurations and parameters you can set up in the funnel. Nevertheless, the above should give you a better idea of how you can use funnel exploration in GA4 going forward.
Generally speaking, the possibilities for customised reports are endless, but depend on the correct setup and tracking in GA4. You can technically have up to 150 customised reports on one account, but the more reports you have, the harder it is to maintain an overview due to the large volume of data. However, user-defined reports encourage greater flexibility and contribute to better and more efficient workflows and performance.
Get started with setting up your GA4 reports
Effective data insight is the foundation of any business strategy and performance optimisation. That is why precise setup of reports in Google Analytics 4 is essential to gaining access to unique, tailored data that can drive your business forward.
The reports we have mentioned here are just a selection of those that could be relevant to you, depending on your KPIs. This is where creativity and the ability to experiment with different report types can truly make a difference.
At Searchmind, we are dedicated to helping e-commerce businesses grow and optimise their operations. We know that setting up reports can seem complex, and we are ready to guide you through the process and ensure you get the most out of your data analysis. We are happy to help you optimise your business through solid data insight and optimisation. Contact us to find out how we can create value for you.


